Twitter Superstars
Deliverables: Information Visualization
Role: User Testing, Interaction Design, Visual Design
Three classmates and I created Twitter Superstars as an exploratory visualization of celebrity behavior on Twitter. We employed parallel coordinates, filtering, brushing, and tooltips to provide an interactive way of exploring the structure of public tweets.
The structural elements we took into account were behavioral indicators, which included tweets per day, replies, retweets, hashtags, links, use of emotions, photos, and days on Twitter.
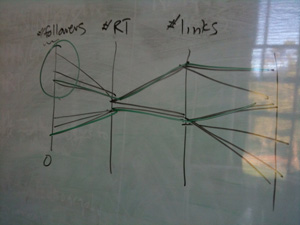
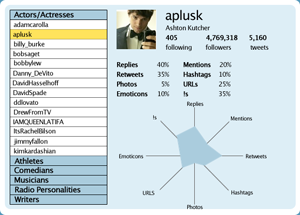
We compiled and categorized dataset of celebrity tweets, chose a set of relevant Twitter behaviors (replies, links, followers, etc), and sketched out how a visualization might look and what information visualization tools it might include. We iteratively designed wireframes of increasing fidelity, eventually building the visualization with Javascript and CSS. Among the improvements we made were 1) adding a way for any user to see their own Twitter line in comparison with that of celebrities, and 2) including an interactive list of celebrities that highlights a celebrity's line when his or her name is rolled over. We conducted talk-aloud exploratory tests of two versions of the visualization on four users to learn what they found compelling about the visualization and discover pain points. We addressed these pain points in our final design.